


In 2026, ecommerce performance conversations should have moved beyond generic site-speed scores. Core Web Vitals benchmarks matter because they show whether real shoppers can see products, interact with buying tools, and complete checkout without avoidable friction.
The catch is that the official Google thresholds are only the baseline. For retail teams, the benchmark that matters most is not whether the homepage gets a green score. It is whether revenue-critical templates, especially product listing pages, product detail pages, cart, checkout, and search results, perform well for real users on real devices.
A category page can pass in the lab and still feel sluggish on mobile when filters lag. A product page can show a good average LCP while best-selling SKUs fail because image galleries, reviews, recommendations, and personalization compete for the main thread. A checkout can meet a broad sitewide benchmark while payment interactions frustrate shoppers at the exact moment revenue is at stake.
That is why ecommerce teams need a benchmark model built around shopper behavior, not just engineering compliance.
Start with the official Core Web Vitals benchmarks
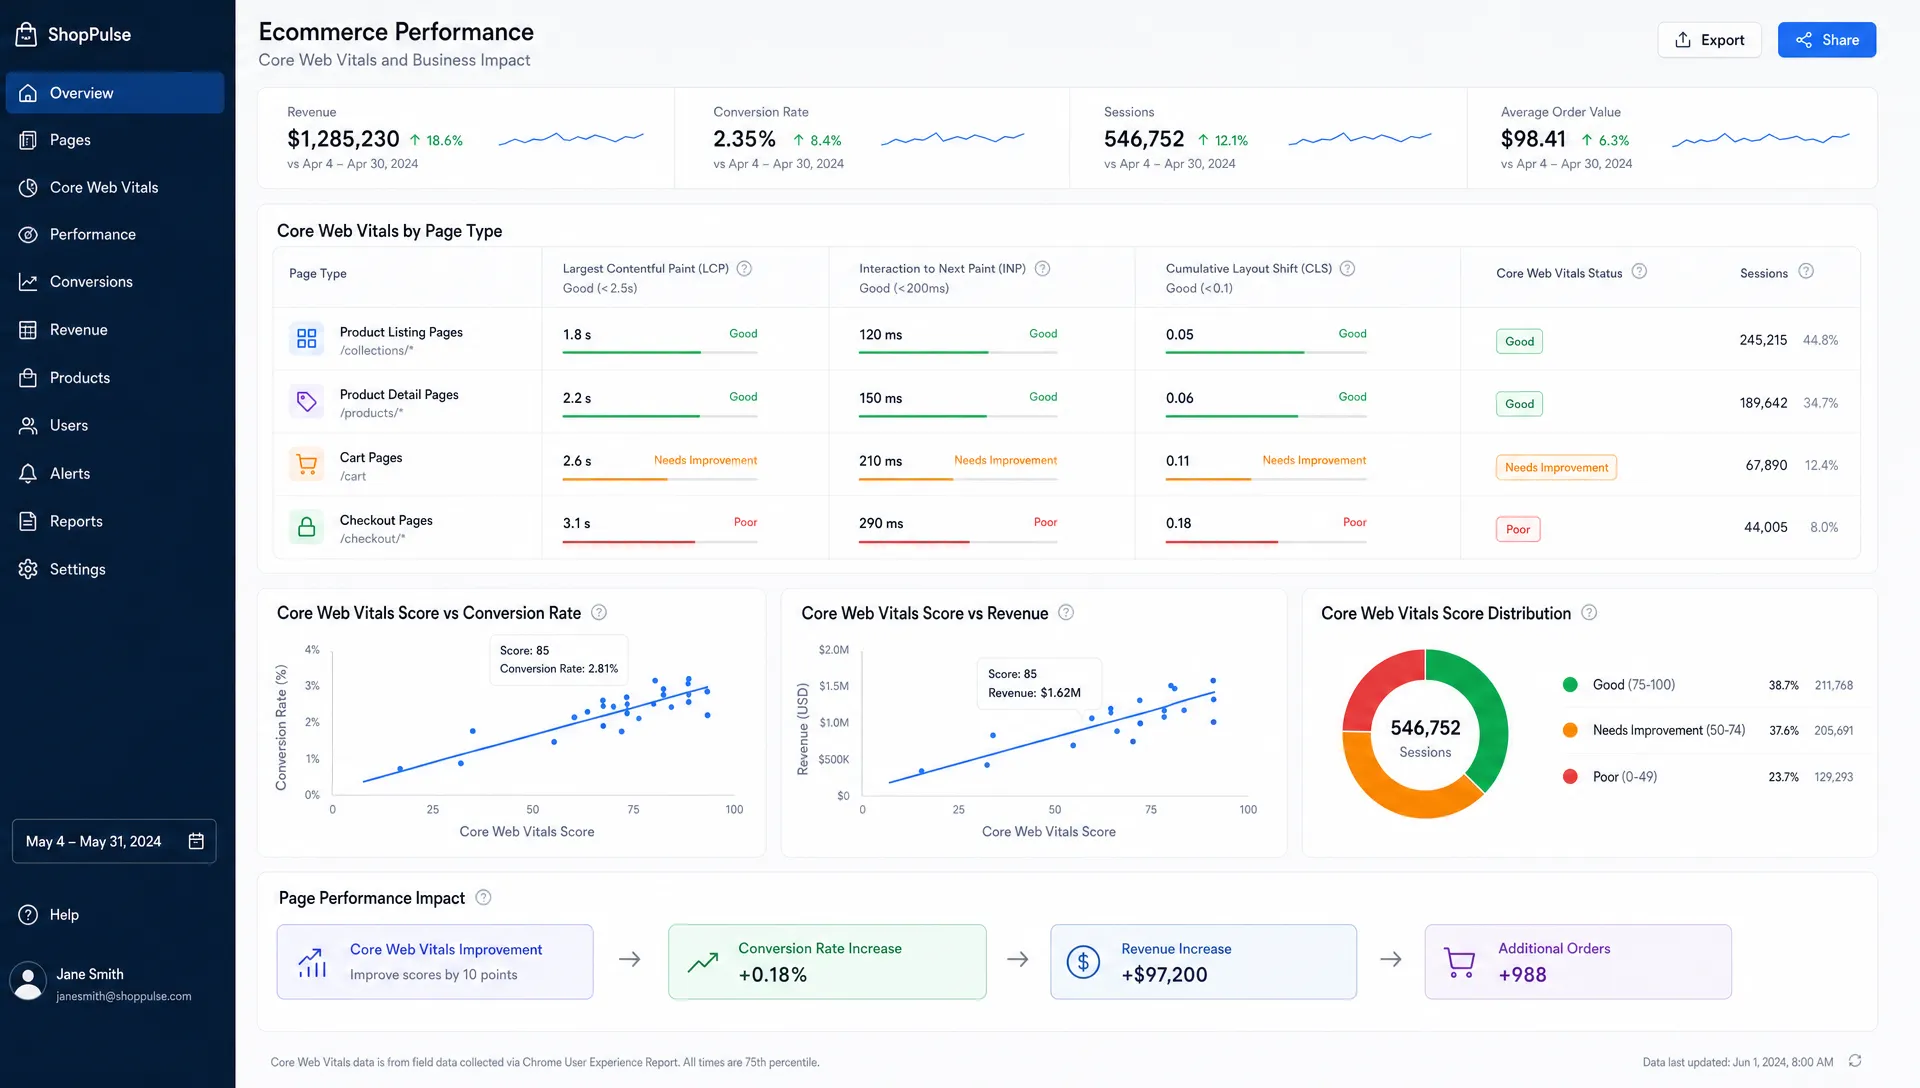
Google’s Core Web Vitals measure loading, interactivity, and visual stability. According to Google’s Core Web Vitals guidance, the current metrics are LCP, INP, and CLS, measured at the 75th percentile of page views across mobile and desktop. INP replaced FID as a Core Web Vital in March 2024, making interaction responsiveness a more important part of performance reporting.
| Metric | Good | Needs improvement | Poor | Ecommerce meaning |
|---|---|---|---|---|
| Largest Contentful Paint, LCP | 2.5 seconds or less | More than 2.5 seconds and up to 4 seconds | More than 4 seconds | The main product, category, or checkout content appears quickly enough for shoppers to orient themselves. |
| Interaction to Next Paint, INP | 200 milliseconds or less | More than 200 milliseconds and up to 500 milliseconds | More than 500 milliseconds | Key interactions such as filters, add to cart, size selection, promo codes, and payment actions respond without noticeable delay. |
| Cumulative Layout Shift, CLS | 0.1 or less | More than 0.1 and up to 0.25 | More than 0.25 | Buttons, prices, product cards, and form fields stay visually stable while the page loads. |
These thresholds matter for SEO and user experience, but ecommerce teams should treat them as the floor. Passing Core Web Vitals across a whole origin does not prove that the pages driving revenue are healthy. The sitewide average may hide issues in a specific template, market, device class, or campaign landing page.
If you need the broader conversion context, Space Dinosaurs has covered which Core Web Vitals actually move ecommerce conversions. This article focuses on the benchmark framework itself: what to measure, where to segment, and how to decide what is worth fixing first.
The ecommerce benchmark that matters most: p75 by template
Core Web Vitals are typically evaluated at the 75th percentile, often called p75. That means 75 percent of page experiences should meet the benchmark. For ecommerce, p75 should be reviewed by page template, not only at the domain level.
A practical ecommerce scorecard should separate at least these templates:
| Template | Why it matters | Core benchmark to watch |
|---|---|---|
| Homepage | Often receives branded, campaign, and returning customer traffic. | LCP under 2.5 seconds, CLS under 0.1 for hero and promotional modules. |
| Product listing page, PLP | Drives discovery, filtering, sorting, and category SEO traffic. | LCP under 2.5 seconds, INP under 200 milliseconds for filters and sorting. |
| Product detail page, PDP | Converts product interest into cart intent. | LCP under 2.5 seconds for primary product content, CLS under 0.1 around price, media, and CTAs. |
| Search results | Captures high-intent shoppers who already know what they want. | INP under 200 milliseconds for search input, typeahead, filters, and result updates. |
| Cart | Protects purchase intent and average order value. | INP under 200 milliseconds for quantity, promo, shipping, and cart update actions. |
| Checkout | Converts demand into revenue. | INP under 200 milliseconds and CLS under 0.1 around forms, payment, shipping options, and validation messages. |
This approach changes prioritization. A slow informational page may matter for SEO, but a slow checkout payment interaction should usually be addressed first. A PLP serving high-volume paid search traffic may deserve a stricter target than a low-traffic editorial page.
The same logic applies to device segmentation. Mobile should rarely be averaged with desktop for retail performance decisions. Many ecommerce teams see very different performance profiles across iOS, Android, cellular networks, tablet browsing, and desktop shoppers. If your dashboard only shows one blended number, it is probably hiding the work that matters.
LCP benchmarks: measure the element shoppers need first
LCP measures how long it takes for the largest visible content element to render. In ecommerce, that element should ideally be the content that helps a shopper decide whether they are in the right place.
On a PDP, the LCP element is often the primary product image. On a PLP, it may be a category hero, banner, or first product grid image. On checkout, it might be the order summary or the first visible section of the form. The key question is not only whether LCP is under 2.5 seconds, but whether the right content is becoming visible.
For revenue-critical pages, use the official 2.5 second p75 threshold as the minimum. Consider a stricter internal target of around 2 seconds for top paid landing pages, best-selling PDPs, and high-volume categories. This is especially useful when acquisition costs are high, because a slow first impression can waste media spend before merchandising has a chance to work.
Common LCP blockers in ecommerce include oversized hero images, unoptimized product media, render-blocking CSS, slow server response, delayed client-side rendering, font loading, and tag bloat. Composable stacks can improve flexibility, but they still need performance governance. Every new component, integration, and personalization rule should respect the LCP budget.
INP benchmarks: focus on buying interactions
INP measures responsiveness across the page lifecycle. For ecommerce, this is a major improvement over older interaction metrics because shoppers do not only interact once. They tap size selectors, expand reviews, filter colors, sort listings, apply promo codes, update quantities, choose delivery options, and submit payment.
A good ecommerce INP benchmark starts with the official p75 target of 200 milliseconds or less. But teams should also identify the interactions that are most closely tied to revenue. A poor INP on a low-value accordion may be annoying. A poor INP on add to cart, checkout validation, or payment submission can directly reduce conversion.
High INP often comes from long JavaScript tasks, heavy hydration, complex state updates, overloaded tag managers, personalization scripts, and client-side rendering patterns that make the browser do too much work at once. It can also appear when filtering or search experiences recalculate large product sets on the main thread.
This is where benchmarks should become behavioral. Track INP on key interactions, not just page aggregates. A retailer should know whether size selection responds quickly on mobile PDPs, whether PLP filters feel instant during sale periods, and whether checkout remains responsive when fraud, tax, shipping, payment, and analytics scripts are all active.
CLS benchmarks: protect trust and buying confidence
CLS measures unexpected layout movement. In retail, visual stability is about more than polish. It protects shopper trust.
If a promotional banner loads late and pushes the add-to-cart button down, the shopper may tap the wrong element. If reviews, recommendations, loyalty messages, or delivery estimates shift the page after initial render, the experience feels unreliable. If checkout form fields move while a shopper is entering payment details, even a small shift can create anxiety.
The official CLS benchmark is 0.1 or less. For cart and checkout, many teams should treat that as a hard quality gate. Ecommerce CLS issues often come from missing image dimensions, late-loading badges, dynamic ad slots, injected personalization modules, expandable content without reserved space, and third-party widgets that appear after the core layout has loaded.
The fix is usually less glamorous than a redesign. Reserve space for known modules. Define width and height for product imagery. Avoid injecting banners above primary content after render. Load nonessential content below the fold. Make skeleton states match final dimensions. These details keep the buying interface stable.
Third-party benchmarks: every script needs a business case
Modern ecommerce storefronts depend on third-party services. Reviews, loyalty, chat, experimentation, payments, fraud detection, tax, recommendations, consent, analytics, and shipping tools can all support revenue. The performance problem is not that third parties exist. The problem is when nobody owns their cost.
Logistics and fulfillment content can be business critical, especially for retailers that surface delivery promises, tracking, or B2B supply chain information. For example, brands evaluating freight forwarding, warehousing, trucking, and 3PL services may need operational data and delivery workflows to connect with the ecommerce experience, but any related widgets or integrations still need a clear performance budget.
A useful third-party benchmark should answer four questions: what business outcome does the script support, when does it need to load, which templates need it, and what happens if it is delayed or fails. Not every tag belongs on every page. A checkout-critical payment script deserves different treatment than a low-priority marketing pixel.
| Third-party category | Benchmark question | Practical rule |
|---|---|---|
| Analytics and pixels | Does this tag improve decision-making or paid media efficiency? | Audit regularly and remove duplicate or unused tags. |
| Reviews and UGC | Does it influence PDP conversion? | Reserve layout space and avoid blocking primary product content. |
| Chat and support | Is it needed before purchase on this template? | Delay loading until intent is detected when possible. |
| Personalization | Does the lift justify added complexity? | Test against conversion and Core Web Vitals together. |
| Checkout services | Is it required to complete payment, tax, fraud, or delivery selection? | Prioritize reliability, fast interaction, and graceful fallback. |
Field data beats lab scores, but you need both
Lab tools are useful for debugging because they provide repeatable tests. Field data is essential because it shows what real shoppers experience. The Chrome UX Report provides public field data for eligible origins and URLs, while real user monitoring can capture richer detail for your own traffic, templates, devices, releases, and customer segments.
A strong ecommerce measurement setup uses both:
| Data type | Best use | Limitation |
|---|---|---|
| Lab testing | Debugging before release, comparing builds, identifying render-blocking resources. | Does not represent every shopper, device, network, or logged-in state. |
| CrUX field data | Understanding real-user Core Web Vitals at origin or URL level. | May lack detail for low-traffic pages or internal segmentation. |
| Real user monitoring | Connecting performance to template, device, geography, traffic source, and revenue outcomes. | Requires implementation quality, governance, and clear reporting ownership. |
This is where ecommerce teams can connect performance work to business outcomes. If p75 LCP improves on mobile PLPs, does product engagement rise? If INP improves on checkout, do error rates or abandonment change? If CLS improves on PDPs, does add-to-cart rate increase?
For a practical framework, Space Dinosaurs explains how to turn site speed into revenue by tying technical metrics to shopper behavior and commercial KPIs.
The benchmarks leadership should review
Executives do not need a waterfall chart in every meeting. They need a performance scorecard that shows risk, opportunity, and business impact. A useful monthly scorecard should include the official Core Web Vitals thresholds, but it should also show where performance is hurting commercial outcomes.
| Leadership benchmark | Why it matters | Suggested view |
|---|---|---|
| Core Web Vitals pass rate by template | Reveals whether critical shopping pages are healthy. | Mobile and desktop p75 for PLP, PDP, cart, checkout, and search. |
| Revenue exposed to poor experiences | Connects performance to business scale. | Sessions, revenue, and conversion rate for pages failing one or more CWV metrics. |
| Checkout responsiveness | Protects the highest-intent part of the funnel. | INP and error rate for payment, shipping, promo, and form validation actions. |
| Third-party cost | Shows whether integrations are slowing the storefront. | Script weight, main-thread time, load timing, owner, and business purpose. |
| Release impact | Prevents regressions from becoming normal. | Before and after comparison by template and device. |
This structure helps engineering, ecommerce, marketing, UX, and analytics teams make tradeoffs together. A new personalization feature may be worth a small cost if it lifts revenue. A bloated tag that slows checkout without a clear return should be challenged.
How to set Core Web Vitals benchmarks for the next quarter
Quarterly benchmarking works best when teams separate official thresholds from operating targets. The official thresholds tell you where Google and web standards draw the line. Operating targets tell your teams where the business needs to be faster than average.
Start with the last 28 days of field data, then segment by template, device, and traffic source. Identify the routes that represent the most revenue or the highest strategic priority. Rank issues by commercial exposure, not only by severity score. Then choose a small number of benchmarks that can be owned by a team and improved within the quarter.
A practical quarterly plan can follow this sequence:
- Baseline Core Web Vitals at p75 for mobile and desktop by template.
- Identify the top revenue pages or routes failing LCP, INP, or CLS.
- Add p95 monitoring for checkout and other high-risk interactions.
- Assign owners for the biggest LCP element, slowest interactions, and worst layout shifts.
- Set a regression budget so new releases cannot quietly undo improvements.
- Review conversion, revenue per session, bounce rate, and abandonment alongside performance changes.
Google’s older mobile speed research found that as page load time increases from 1 second to 3 seconds, the probability of bounce rises by 32 percent, according to Think with Google. Exact outcomes vary by brand, but the directional lesson still holds: shoppers do not experience performance as a technical report. They experience it as waiting, hesitation, distrust, or momentum.
Common benchmarking mistakes ecommerce teams should avoid
The first mistake is optimizing only the homepage. Homepages are visible, but they are not always where conversion friction is hiding. A homepage can pass while PDPs, PLPs, search, cart, and checkout underperform.
The second mistake is relying only on Lighthouse scores. Lighthouse is valuable, but a lab score cannot replace real-user data. Use lab tools to diagnose, then use field data to prioritize.
The third mistake is averaging mobile and desktop together. Mobile shoppers often face slower networks, lower-powered devices, and different interaction patterns. If mobile revenue matters, mobile benchmarks need their own targets.
The fourth mistake is ignoring the release process. Core Web Vitals should not be a cleanup project every six months. They should be part of design reviews, component standards, vendor governance, QA, and analytics reporting.
If you suspect performance issues are already leaking revenue, this 30-minute guide to a performance and revenue leak audit is a useful starting point.
Frequently Asked Questions
What are good Core Web Vitals benchmarks for ecommerce? Use Google’s official thresholds as the baseline: LCP at 2.5 seconds or less, INP at 200 milliseconds or less, and CLS at 0.1 or less at the 75th percentile. For ecommerce, review these by template, device, and funnel stage rather than relying only on a sitewide score.
Should ecommerce teams focus on LCP, INP, or CLS first? Prioritize the metric that affects the highest-value shopper journey. For many retailers, LCP issues on PLPs and PDPs affect discovery, while INP and CLS issues in checkout can directly threaten conversion. The right order depends on revenue exposure.
Is passing Core Web Vitals enough for ecommerce SEO? No. Core Web Vitals are part of page experience, but ecommerce SEO also depends on technical crawlability, content quality, internal linking, structured data, relevance, inventory, and authority. Passing CWV helps, but it is not a complete SEO strategy.
How often should Core Web Vitals benchmarks be reviewed? Review executive scorecards monthly, monitor regressions continuously, and reassess operating targets quarterly. Review more frequently before peak trading periods, major redesigns, platform migrations, or large marketing campaigns.
Why does p75 matter? p75 shows whether most real users get a good experience, not just the average user. It is the benchmark Google uses for Core Web Vitals assessment and is more useful than a simple average for spotting widespread performance issues.
Turn benchmarks into better shopping experiences
Core Web Vitals benchmarks are only valuable when they change what teams build, ship, and measure. For ecommerce, the goal is not a prettier report. The goal is a faster, more stable, more responsive storefront that helps shoppers move from interest to purchase with less friction.
Space Dinosaurs helps retail brands modernize ecommerce experiences through AI-enabled engineering, UX design, analytics, performance optimization, and ongoing improvement. If your team needs to connect Core Web Vitals benchmarks to revenue, conversion, and operational priorities, the next step is to turn your performance data into a focused roadmap.