


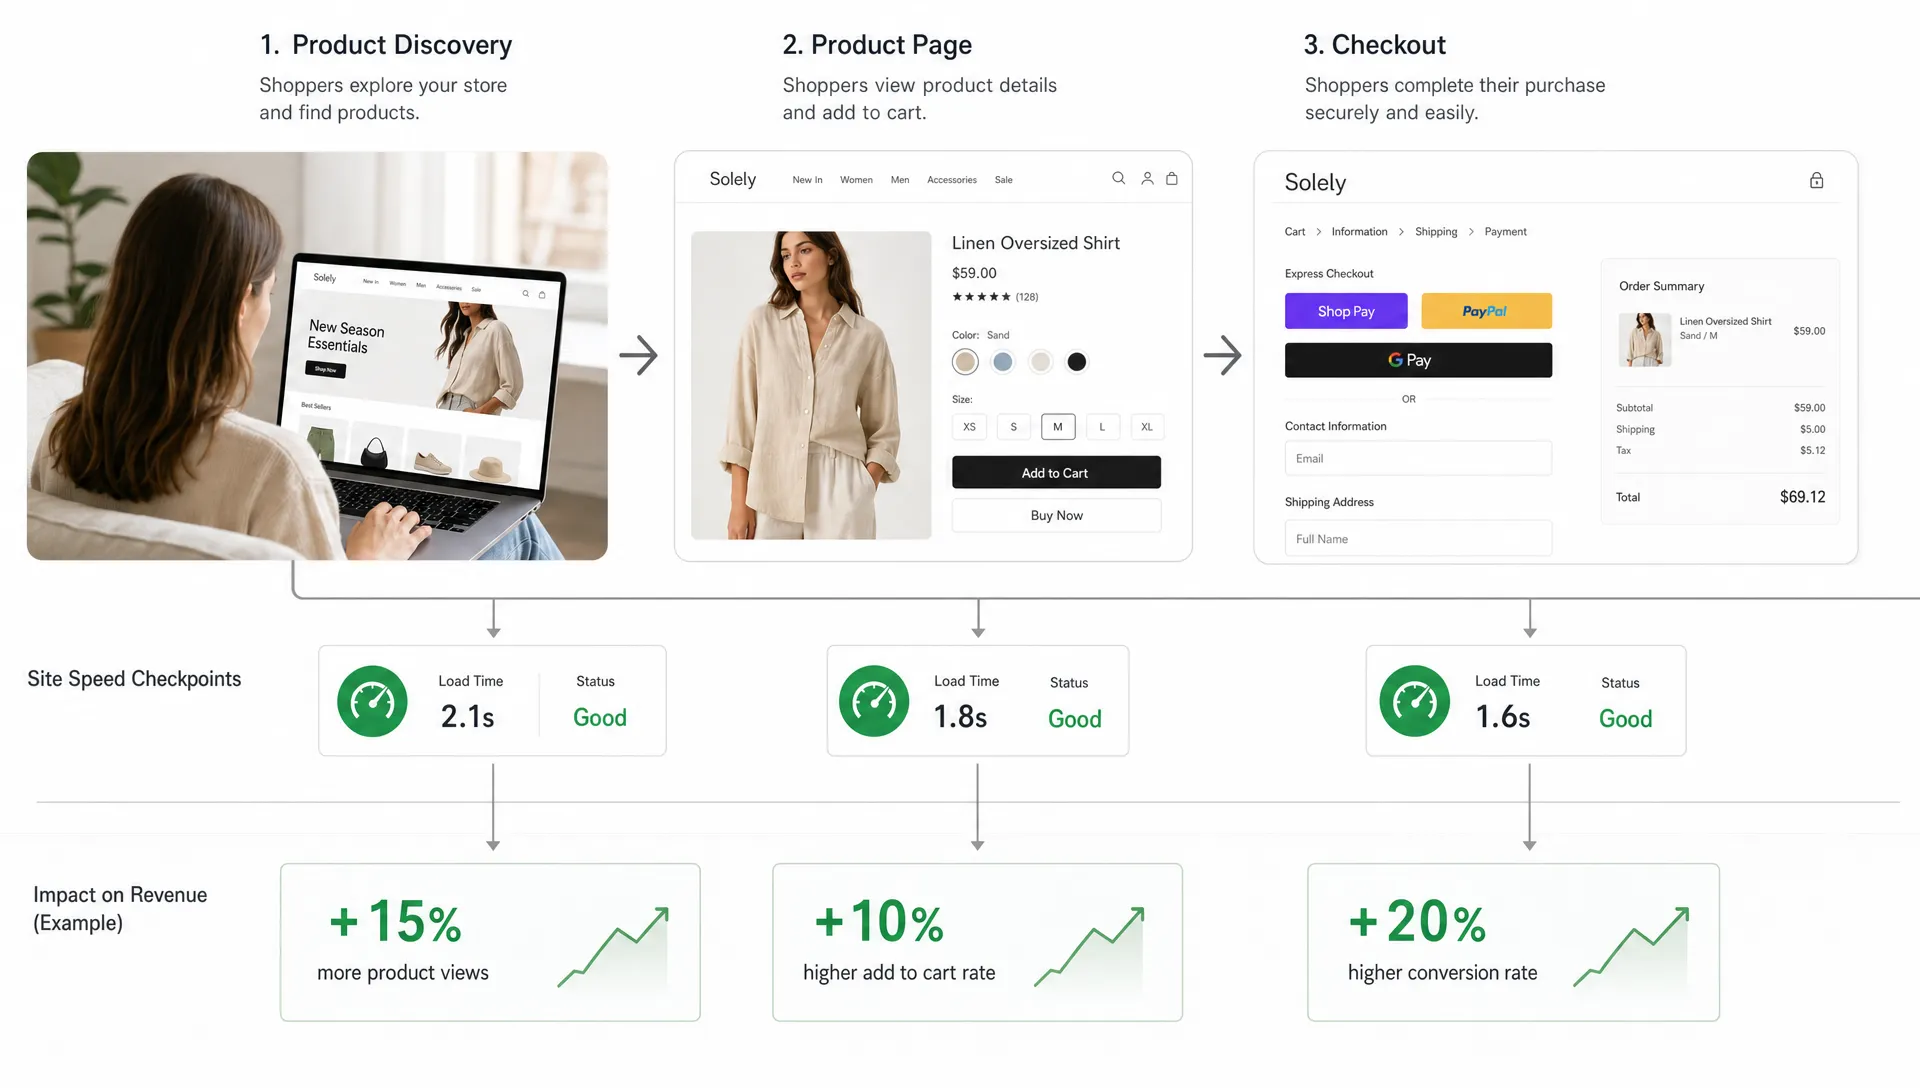
Site speed is one of the cleanest revenue levers in e-commerce because it shortens the distance between shopper intent and purchase. A faster product page means shoppers see the item sooner. A more responsive filter means they can narrow a category without friction. A stable checkout means fewer mistaps, fewer errors, and fewer abandoned carts.
The problem is that many teams still talk about speed as if it were only a technical score. Lighthouse grades, page weight, and JavaScript bundles matter, but they do not always answer the executive question: how much revenue are we leaving on the table?
High-performing e-commerce teams approach site speed differently. They connect performance metrics to funnel behavior, prioritize the templates closest to money, and create a repeatable workflow for turning milliseconds into margin. In other words, they treat the site as a commercial system, not just a codebase. If that mindset resonates, Space Dinosaurs has written more about why your site is a revenue lever, not a disconnected engineering metric.
Why site speed affects more than load time
Site speed influences revenue because it affects every micro-decision in the buying journey. Shoppers do not experience a site as a performance report. They experience hesitation, delay, jumping layouts, unresponsive buttons, slow image galleries, broken-feeling filters, and checkout fields that lag when they type.
Those moments create doubt. In retail, doubt is expensive.
A fast site helps shoppers keep momentum. It makes the store feel more trustworthy, reduces cognitive load, and makes product discovery easier on mobile connections. It can also support acquisition efficiency because landing pages that load quickly tend to waste less paid traffic. Organic visibility can benefit too, since Google uses page experience signals as part of search systems, although speed should never be reduced to an SEO checkbox.
Google's Core Web Vitals guidance defines three user-experience thresholds that are especially useful for e-commerce teams: Largest Contentful Paint at 2.5 seconds or faster, Interaction to Next Paint at 200 milliseconds or faster, and Cumulative Layout Shift at 0.1 or lower. Since 2024, Interaction to Next Paint has replaced First Input Delay as a Core Web Vital, which makes responsiveness more visible for teams running interactive stores with filters, personalization, cart drawers, and third-party scripts.
The commercial takeaway is simple: speed is not one metric. It is the quality of the shopping experience under real conditions.
Translate performance metrics into shopper outcomes
The first step is to stop reporting speed in isolation. A dashboard that says a PDP has poor LCP is useful for engineers, but a revenue team needs to know what that means for behavior. Does poor LCP delay the hero image? Does poor INP make the add-to-cart button feel broken? Does CLS cause shoppers to tap the wrong option?
Use this translation layer to make performance data meaningful outside engineering.
| Metric | What it measures | Shopper outcome | Revenue question |
|---|---|---|---|
| Largest Contentful Paint (LCP) | How quickly the main content appears | Shoppers see the product, campaign, or category quickly | Are we making visitors wait before they can evaluate the offer? |
| Interaction to Next Paint (INP) | How responsive the page is after user input | Filters, menus, selectors, and cart actions feel immediate | Are shoppers abandoning because the site feels frozen or unreliable? |
| Cumulative Layout Shift (CLS) | How visually stable the page is | Buttons, images, and content do not jump unexpectedly | Are layout shifts causing misclicks, frustration, or checkout errors? |
| Time to First Byte (TTFB) | How quickly the server responds | Pages begin loading sooner, especially on mobile | Are backend or platform delays slowing every downstream experience? |
| JavaScript execution | How much work blocks the browser | Interactions remain smooth on lower-end devices | Are apps, tags, or custom scripts creating hidden friction? |
This table is also useful for prioritization meetings. Instead of asking whether the team should improve LCP, ask which revenue action is being delayed. The best speed work is tied to a shopper behavior that matters.
Build a speed-to-revenue model
To turn site speed into revenue, teams need a model that connects performance segments to commercial outcomes. It does not need to be perfect at first. It needs to be directional enough to compare opportunities.
A practical formula looks like this:
Incremental revenue opportunity = affected sessions x baseline conversion rate x expected relative lift x average order value
For example, imagine a mobile PDP segment with 500,000 monthly sessions, a 2.0% conversion rate, and an $85 average order value. That segment generates about $850,000 in monthly revenue. If the team improves the slowest experience segment and achieves a conservative 3% relative lift in conversion, the opportunity is:
500,000 x 2.0% x 3.0% x $85 = $25,500 in incremental monthly revenue
This is not a promise. It is an estimation framework. The expected lift should be based on your own historical data, controlled experiments, or conservative benchmarks. The point is to stop treating performance work as an abstract cost and start comparing it against paid media, CRO tests, UX improvements, and platform projects.
A stronger model separates users by performance experience rather than averaging the whole site. The average can hide the problem. A store may appear healthy overall while mobile shoppers on 4G connections, certain Android devices, or international routes are having a meaningfully worse experience.
The Chrome User Experience Report can help teams understand real-user performance at scale, while real user monitoring tools and analytics platforms can connect performance data to conversion, revenue per session, add-to-cart rate, and checkout completion.
Prioritize the pages closest to revenue
Speed work often starts on the homepage because it is visible, political, and easy to discuss. For many retailers, though, the homepage is not where the biggest revenue opportunity lives. Paid traffic may land on campaign pages. Organic traffic may land on category pages. Returning customers may go straight to search, PDPs, cart, or checkout.
That is why e-commerce teams should prioritize by template and funnel role. Space Dinosaurs covers this in more detail in its Core Web Vitals for Ecommerce guide, but the principle is straightforward: optimize the pages where speed blocks buying intent.
| Template | Common speed issue | Why it matters commercially |
|---|---|---|
| Product listing pages | Heavy images, slow filters, excessive scripts | Shoppers cannot narrow choices quickly, which reduces product discovery |
| Product detail pages | Slow hero media, blocking reviews, delayed variant selectors | Shoppers wait before evaluating the item or adding it to cart |
| Search results | Slow rendering, unresponsive sort and filter controls | High-intent shoppers lose momentum when they already know what they want |
| Cart | Third-party scripts, promo logic, shipping estimators | Friction appears after buying intent has already been created |
| Checkout | Layout shifts, slow payment methods, validation delays | Small delays can directly increase abandonment |
| Campaign landing pages | Large creative assets, tag overload, personalization delays | Paid traffic gets wasted before the offer is visible |
This template view also helps teams avoid false wins. Improving a low-traffic page by one second may look impressive, but improving a slower PDP template with millions of monthly sessions usually matters more.
Choose fixes that match the revenue bottleneck
Not every performance improvement produces the same commercial effect. The right fix depends on where shoppers feel friction.
| Bottleneck | Revenue risk | High-value fixes to evaluate |
|---|---|---|
| Main product image loads slowly | Shoppers cannot assess the product quickly | Modern image formats, responsive image sizing, image CDN rules, preload for priority media |
| Filters or variant selectors lag | Shoppers feel the site is broken | JavaScript reduction, code splitting, event handler cleanup, less main-thread blocking work |
| Cart drawer is slow to open | Add-to-cart confidence drops | Lighter cart logic, deferred noncritical scripts, optimized API calls |
| Checkout fields shift or lag | Errors and abandonment increase | Stable layout reservations, simplified validation, faster payment component loading |
| Campaign pages are heavy | Paid traffic efficiency drops | Creative asset budgets, tag governance, server-side rendering or caching where appropriate |
| Third-party scripts accumulate | Every page becomes slower over time | Script audits, ownership rules, load sequencing, removal of low-value tags |
One of the most common mistakes is treating all third-party scripts as untouchable because each one has a business owner. Reviews, chat, personalization, analytics, affiliate tags, heatmaps, consent tools, and A/B testing platforms can all be legitimate. The issue is that their combined cost is rarely owned by one team.
A mature performance workflow asks every script to justify its place. What revenue, insight, or operational value does it create? Does it need to load before the shopper can see the product? Can it be delayed until interaction? Can it run only on relevant templates? If a script cannot answer those questions, it is not free. It is paid for with shopper patience.
Make site speed a cross-functional operating rhythm
E-commerce site speed becomes a revenue lever when it has governance. A one-time performance sprint can help, but speed decays as new campaigns, apps, scripts, experiments, and design components are added. The teams that sustain gains build performance into their operating model.
That model usually includes clear ownership across functions:
- Product owns the commercial goal and decides which funnel problems matter most.
- Engineering owns architecture, implementation quality, and performance budgets.
- UX and creative own experience quality, asset discipline, and interaction clarity.
- Marketing owns campaign tags, landing page requirements, and the cost of added scripts.
- Merchandising owns content weight, product media expectations, and template complexity.
- Analytics owns measurement, segmentation, and revenue attribution.
This does not mean every release needs a long performance review. It means the team has a shared definition of acceptable tradeoffs. A new personalization feature may be worth additional JavaScript if it lifts conversion more than it slows the page. A low-value tracking tag may not be worth the latency it adds to checkout.
The key is to make those tradeoffs explicit before they reach production.
Performance budgets are a practical way to do that. A budget can set limits for page weight, JavaScript execution, image size, third-party scripts, Core Web Vitals thresholds, or template-level regression. The budget should be strictest where revenue intent is highest, especially PDP, cart, and checkout.
Measure results without fooling yourself
Speed improvements can be hard to measure because e-commerce sites are noisy. Promotions, inventory changes, seasonality, pricing, paid media mix, and merchandising can all affect conversion. Teams need measurement discipline so they do not overclaim or undercount the impact.
Start by measuring field data, not only lab data. Lab tools are excellent for debugging because they provide controlled conditions. Field data shows what real shoppers experience across devices, browsers, locations, networks, and sessions. Both matter, but revenue cases should lean heavily on real-user data.
Segment before and after results by template, device, traffic source, geography, and performance bucket. If the slowest 25% of mobile PDP sessions improved significantly, compare their behavior to similar traffic before the change. Look at conversion rate, add-to-cart rate, revenue per session, bounce rate, product image engagement, checkout starts, and checkout completion.
When possible, test changes with controlled experiments. Not every speed improvement can be A/B tested cleanly, especially infrastructure work, but many front-end changes can be rolled out gradually. Even when a true experiment is not possible, holdout analysis, phased releases, or comparisons across similar templates can improve confidence.
A useful rule: report both the technical win and the commercial win. Technical win: PDP p75 LCP improved from 3.4 seconds to 2.3 seconds on mobile. Commercial win: mobile PDP add-to-cart rate increased by 4.1% among affected sessions, with no negative impact on AOV. That combination earns trust.
Use AI to find performance revenue opportunities faster
AI is not a replacement for engineering judgment, but it can help e-commerce teams find patterns faster. For large retail sites with thousands of products, templates, content blocks, tags, and customer segments, manual analysis can miss where performance issues are concentrated.
AI-assisted workflows can help cluster slow sessions, detect recurring performance regressions, summarize user-experience patterns, and identify which templates or components are most often associated with revenue drop-offs. The most valuable use case is prioritization. Instead of creating a giant backlog of technical fixes, teams can identify the speed issues most likely to affect conversion.
This is where retail-focused digital transformation matters. Speed work is not just minifying files. It touches architecture, UX, analytics, experimentation, merchandising operations, and commercial decision-making. Teams need a process that combines engineering depth with revenue context.
What strong e-commerce teams stop doing
Teams that consistently turn site speed into revenue usually stop a few habits.
They stop celebrating perfect scores that do not affect shoppers. A 100 score on one page is less valuable than a measurable improvement across revenue-critical templates.
They stop treating speed as a launch task. Performance needs to be monitored after every campaign, integration, personalization change, and major release.
They stop letting every vendor script load everywhere. Third-party tools should have owners, loading rules, and a clear value case.
They stop averaging away pain. A sitewide median can look fine while high-value mobile traffic struggles.
Most importantly, they stop separating technical performance from commercial performance. Speed is part of conversion rate optimization, customer experience, acquisition efficiency, and retention.
The practical playbook
A simple speed-to-revenue workflow can be summarized in five moves.
- Map speed by funnel template: Measure LCP, INP, CLS, TTFB, JavaScript cost, and page weight for PLP, PDP, search, cart, checkout, and campaign landing pages.
- Connect performance to behavior: Join speed data with conversion, add-to-cart, checkout start, checkout completion, revenue per session, and AOV.
- Prioritize by affected revenue: Focus on slow experiences with high traffic, high intent, and measurable friction.
- Fix the bottleneck, not the score: Choose improvements that match the shopper problem, such as delayed product media, unresponsive filters, or unstable checkout elements.
- Create a release rhythm: Add performance budgets, regression monitoring, script governance, and post-release measurement.
The result is a performance program that leadership can understand. Instead of asking for time to improve a metric, the team can say: this fix targets mobile PDP sessions worth $850,000 per month, reduces the delay before shoppers see the product, and will be measured against add-to-cart and revenue per session.
That is how site speed becomes a revenue conversation.
Frequently Asked Questions
How does site speed increase e-commerce revenue? Site speed increases revenue by reducing friction across the shopping journey. Faster pages help shoppers see products sooner, interact with filters and carts more smoothly, and complete checkout with fewer delays or errors.
Which Core Web Vital matters most for e-commerce? It depends on the bottleneck. LCP is often critical for product and landing pages because shoppers need to see the main content quickly. INP is crucial for interactive pages with filters, variant selectors, cart drawers, and checkout inputs. CLS matters when layout shifts cause confusion or misclicks.
How should an e-commerce team calculate the ROI of site speed work? Start with affected sessions, baseline conversion rate, average order value, and a conservative expected lift. Then compare the estimated incremental revenue with the cost of engineering, design, tooling, or platform work. Validate the estimate with field data or experiments where possible.
Should teams optimize mobile or desktop first? Most retail teams should examine mobile first because mobile traffic is often large and more sensitive to network, device, and JavaScript constraints. The right answer still depends on your revenue mix, traffic sources, and where performance data shows the biggest gap.
How often should site speed be reviewed? Site speed should be monitored continuously and reviewed during major releases, campaign launches, new third-party integrations, and template changes. Performance tends to degrade over time unless teams make it part of the normal operating rhythm.
Turn speed improvements into measurable growth
If your e-commerce team knows site speed matters but needs a clearer path from performance data to revenue impact, Space Dinosaurs can help. Our retail-focused approach combines AI-enabled engineering, UX, analytics, and ongoing optimization to improve the parts of your site that influence conversion.
For teams that want a continuous improvement engine rather than another one-time audit, explore Momentum, Space Dinosaurs' e-commerce growth and website optimization service.